EC50: Difference between revisions
No edit summary |
No edit summary |
||
| Line 1: | Line 1: | ||
{{DISPLAYTITLE:EC<sub>50</sub>}} | {{DISPLAYTITLE:EC<sub>50</sub>}} | ||
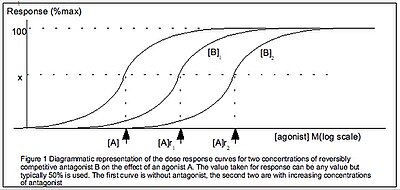
[[File:Dose_response_antagonist.jpg|right|thumb|400px|The tissue response (y-axis) to an agonist, in log concentration (x-axis), in the presence of different antagonist concentrations. The EC<sub>50</sub> of the agonist is represented by the x co-ordinate that corresponds with the half-maximum of the leftmost curve. This is denoted by [A]]] | [[File:Dose_response_antagonist.jpg|right|thumb|400px|The tissue response (y-axis) to an agonist, in log concentration (x-axis), in the presence of different antagonist concentrations. The EC<sub>50</sub> of the agonist is represented by the x co-ordinate that corresponds with the half-maximum of the leftmost curve. This is denoted by [A]]] | ||
'''Half maximal effective concentration''' ('''EC<sub>50</sub>''') is a measure of the concentration of a drug, antibody or toxicant which induces a | '''Half maximal effective concentration''' ('''EC<sub>50</sub>''') is a measure of the concentration of a drug, antibody or toxicant which induces a biological response halfway between the baseline and maximum after a specified exposure time.<ref>{{cite web|url=http://www.graphpad.com/curvefit/introduction89.htm |title=Introducing dose response curves |archive-url=https://web.archive.org/web/20120730150339/http://www.graphpad.com/curvefit/introduction89.htm |archive-date=2012-07-30 |publisher=Graphpad Software}}</ref> More simply, EC<sub>50</sub> can be defined as the ''concentration required to obtain a 50% [...] effect''<ref>{{Cite journal |last1=Chen |first1=Zheng |last2=Bertin |first2=Riccardo |last3=Froldi |first3=Guglielmina |date=2013-05-01 |title=EC50 estimation of antioxidant activity in DPPH assay using several statistical programs |url=https://www.sciencedirect.com/science/article/pii/S0308814612016020 |journal=Food Chemistry |language=en |volume=138 |issue=1 |pages=414–420 |doi=10.1016/j.foodchem.2012.11.001 |pmid=23265506 |issn=0308-8146}}</ref> and may be also written as [A]<sub>50</sub>.<ref name = Terms>{{cite journal |title=International Union of Pharmacology Committee on Receptor Nomenclature and Drug Classification. XXXVIII. Update on Terms and Symbols in Quantitative Pharmacology|url=https://www.guidetopharmacology.org/pdfs/termsAndSymbols.pdf|last1=Neubig|first1=Richard R.|journal=Pharmacological Reviews|year=2003|volume=55|issue=4|pages=597–606|doi=10.1124/pr.55.4.4|pmid=14657418|s2cid=1729572}}</ref> It is commonly used as a measure of a drug's potency, although the use of EC<sub>50</sub> is preferred over that of 'potency', which has been criticised for its vagueness.<ref name = Terms/> EC<sub>50</sub> is a measure of concentration, expressed in molar units (M), where 1 M is equivalent to 1 mol/L. | ||
The EC<sub>50</sub> of a ''graded'' | The EC<sub>50</sub> of a ''graded'' dose response curve therefore represents the concentration of a compound where 50% of its maximal effect is observed.<ref>{{cite web|url=http://www.biochem.northwestern.edu/holmgren/Glossary/Definitions/Def-E/EC50.html|title=Northwestern Molbiosci EC50 definition|access-date=2019-05-27}}</ref> | ||
The EC<sub>50</sub> of a ''quantal'' dose response curve represents the concentration of a compound where 50% of the population exhibit a response,<ref>{{Cite web |url=http://www.merckvetmanual.com/mvm/index.jsp?cfile=htm%2Fbc%2F190116.htm |title=Drug Dose and Clinical Response |access-date=2019-04-16 |archive-url=https://web.archive.org/web/20070220004824/http://www.merckvetmanual.com/mvm/index.jsp?cfile=htm%2Fbc%2F190116.htm |archive-date=2007-02-20 |url-status=dead }}</ref> after a specified exposure duration. | The EC<sub>50</sub> of a ''quantal'' dose response curve represents the concentration of a compound where 50% of the population exhibit a response,<ref>{{Cite web |url=http://www.merckvetmanual.com/mvm/index.jsp?cfile=htm%2Fbc%2F190116.htm |title=Drug Dose and Clinical Response |access-date=2019-04-16 |archive-url=https://web.archive.org/web/20070220004824/http://www.merckvetmanual.com/mvm/index.jsp?cfile=htm%2Fbc%2F190116.htm |archive-date=2007-02-20 |url-status=dead }}</ref> after a specified exposure duration. | ||
| Line 16: | Line 16: | ||
* [[IC50|IC<sub>50</sub>]] | * [[IC50|IC<sub>50</sub>]] | ||
* {{SeeWikipedia|EC50}} | |||
== References == | == References == | ||
<references /> | <references /> | ||
Revision as of 20:24, 23 December 2023
Half maximal effective concentration (EC50) is a measure of the concentration of a drug, antibody or toxicant which induces a biological response halfway between the baseline and maximum after a specified exposure time.[1] More simply, EC50 can be defined as the concentration required to obtain a 50% [...] effect[2] and may be also written as [A]50.[3] It is commonly used as a measure of a drug's potency, although the use of EC50 is preferred over that of 'potency', which has been criticised for its vagueness.[3] EC50 is a measure of concentration, expressed in molar units (M), where 1 M is equivalent to 1 mol/L.
The EC50 of a graded dose response curve therefore represents the concentration of a compound where 50% of its maximal effect is observed.[4] The EC50 of a quantal dose response curve represents the concentration of a compound where 50% of the population exhibit a response,[5] after a specified exposure duration.
For clarification, a graded dose response curve shows the graded effect of the drug (y axis) over the dose of the drug (x axis) in one or an average of subjects. A quantal dose response curve shows the percentage of subjects where a response is noted in an all-or-none manner (y axis) over the dose of the drug (x axis).
For competition binding assays and functional antagonist assays IC50 is the most common summary measure of the dose-response curve. For agonist/stimulator assays the most common summary measure is the EC50.[6]
The EC50 is also related to IC50 which is a measure of a compound's inhibition (50% inhibition).
See Also
References
- ↑ Introducing dose response curves, http://www.graphpad.com/curvefit/introduction89.htm
- ↑ Chen et al.; "EC50 estimation of antioxidant activity in DPPH assay using several statistical programs" , https://www.sciencedirect.com/science/article/pii/S0308814612016020 , https://doi.org/10.1016/j.foodchem.2012.11.001
- ↑ 3.0 3.1 Neubig et al.; "International Union of Pharmacology Committee on Receptor Nomenclature and Drug Classification. XXXVIII. Update on Terms and Symbols in Quantitative Pharmacology" , https://www.guidetopharmacology.org/pdfs/termsAndSymbols.pdf , https://doi.org/10.1124/pr.55.4.4
- ↑ Northwestern Molbiosci EC50 definition, http://www.biochem.northwestern.edu/holmgren/Glossary/Definitions/Def-E/EC50.html
- ↑ Drug Dose and Clinical Response, http://www.merckvetmanual.com/mvm/index.jsp?cfile=htm%2Fbc%2F190116.htm
- ↑ Cite error: Invalid
<ref>tag; no text was provided for refs namedAssay

