EC50
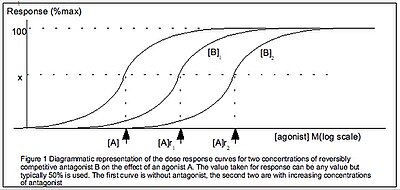
Half maximal effective concentration (EC50) is a measure of the concentration of a drug, antibody or toxicant which induces a biological response halfway between the baseline and maximum after a specified exposure time. More simply, EC50 can be defined as the concentration required to obtain a 50% [...] effect[1] and may be also written as [A]50.[2] It is commonly used as a measure of a drug's potency, although the use of EC50 is preferred over that of 'potency', which has been criticised for its vagueness.[2] EC50 is a measure of concentration, expressed in molar units (M), where 1 M is equivalent to 1 mol/L.
The EC50 of a graded dose response curve therefore represents the concentration of a compound where 50% of its maximal effect is observed. The EC50 of a quantal dose response curve represents the concentration of a compound where 50% of the population exhibit a response, after a specified exposure duration.
For clarification, a graded dose response curve shows the graded effect of the drug (y axis) over the dose of the drug (x axis) in one or an average of subjects. A quantal dose response curve shows the percentage of subjects where a response is noted in an all-or-none manner (y axis) over the dose of the drug (x axis).
For competition binding assays and functional antagonist assays IC50 is the most common summary measure of the dose-response curve. For agonist/stimulator assays the most common summary measure is the EC50.
The EC50 is also related to IC50 which is a measure of a compound's inhibition (50% inhibition).
See Also
References
- ↑ Chen Z et al.: EC50 estimation of antioxidant activity in DPPH· assay using several statistical programs. Food Chem 2013. (PMID 23265506) [PubMed] [DOI] DPPH(·) assay is a reliable method to determine the antioxidant capacity of biological substrates. The DPPH(·) radical scavenging activity is generally quantified in terms of inhibition percentage of the pre-formed free radical by antioxidants, and the EC(50) (concentration required to obtain a 50% antioxidant effect) is a typically employed parameter to express the antioxidant capacity and to compare the activity of different compounds. In this study, the EC(50) estimation was performed using a comparative approach based on various regression models implemented in six specialized computer programs: GraphPad Prism® version 5.01, BLeSq, OriginPro® 8.5.1, SigmaPlot® 12, BioDataFit® 1.02, and IBM SPSS Statistics® Desktop 19.0. For this project, quercetin, catechin, ascorbic acid, caffeic acid, chlorogenic acid and acetylcysteine were screened as antioxidant standards with DPPH(·) assay to define the EC(50) parameters. All the statistical programs gave similar EC(50) values, but GraphPad Prism® five-parameter analysis pointed out a best performance, also showing a minor variance in relation to the actual EC(50).
- ↑ 2.0 2.1 Neubig RR et al.: International Union of Pharmacology Committee on Receptor Nomenclature and Drug Classification. XXXVIII. Update on terms and symbols in quantitative pharmacology. Pharmacol Rev 2003. (PMID 14657418) [PubMed] [DOI] The recommendations that follow have been updated from the proposals of a Technical Subcommittee set up by the International Union of Pharmacology Committee on Receptor Nomenclature and Drug Classification (Jenkinson DH, Barnard EA, Hoyer D, Humphrey PPA, Leff P, and Shankley NP (1995) International Union of Pharmacology Committee on Receptor Nomenclature and Drug Classification. IX. Recommendations on terms and symbols in quantitative pharmacology. Pharmacol Rev 47:255-266).

